
Cart abandonment statistics from Baymard Institute put the average rate at 70.22%, so roughly 7 of every 10 online shopping carts never become an order. The top reason is extra costs at checkout, cited by 40% of shoppers. This guide covers the reasons in order, which ones a small store can fix, and a short list of checkout changes to make first.
Last reviewed: October 6, 2026. This is general information.
Key takeaways
- The average cart abandonment rate is 70.22%, based on 50 studies compiled by Baymard.
- Extra costs such as shipping, tax and fees are the top reason, at 40%.
- Trust, account creation, a long checkout and site errors each account for 17% to 19%.
- 42% of shoppers who abandoned said they were just browsing, so not every lost cart is a lost sale.
- Most of the other reasons can be fixed in store settings, checkout design and hosting.
The cart abandonment rate in numbers
Baymard Institute’s cart abandonment page, last updated September 22, 2025, averages 50 studies to reach 70.22%. Figure 1 puts that next to the share of carts that complete.
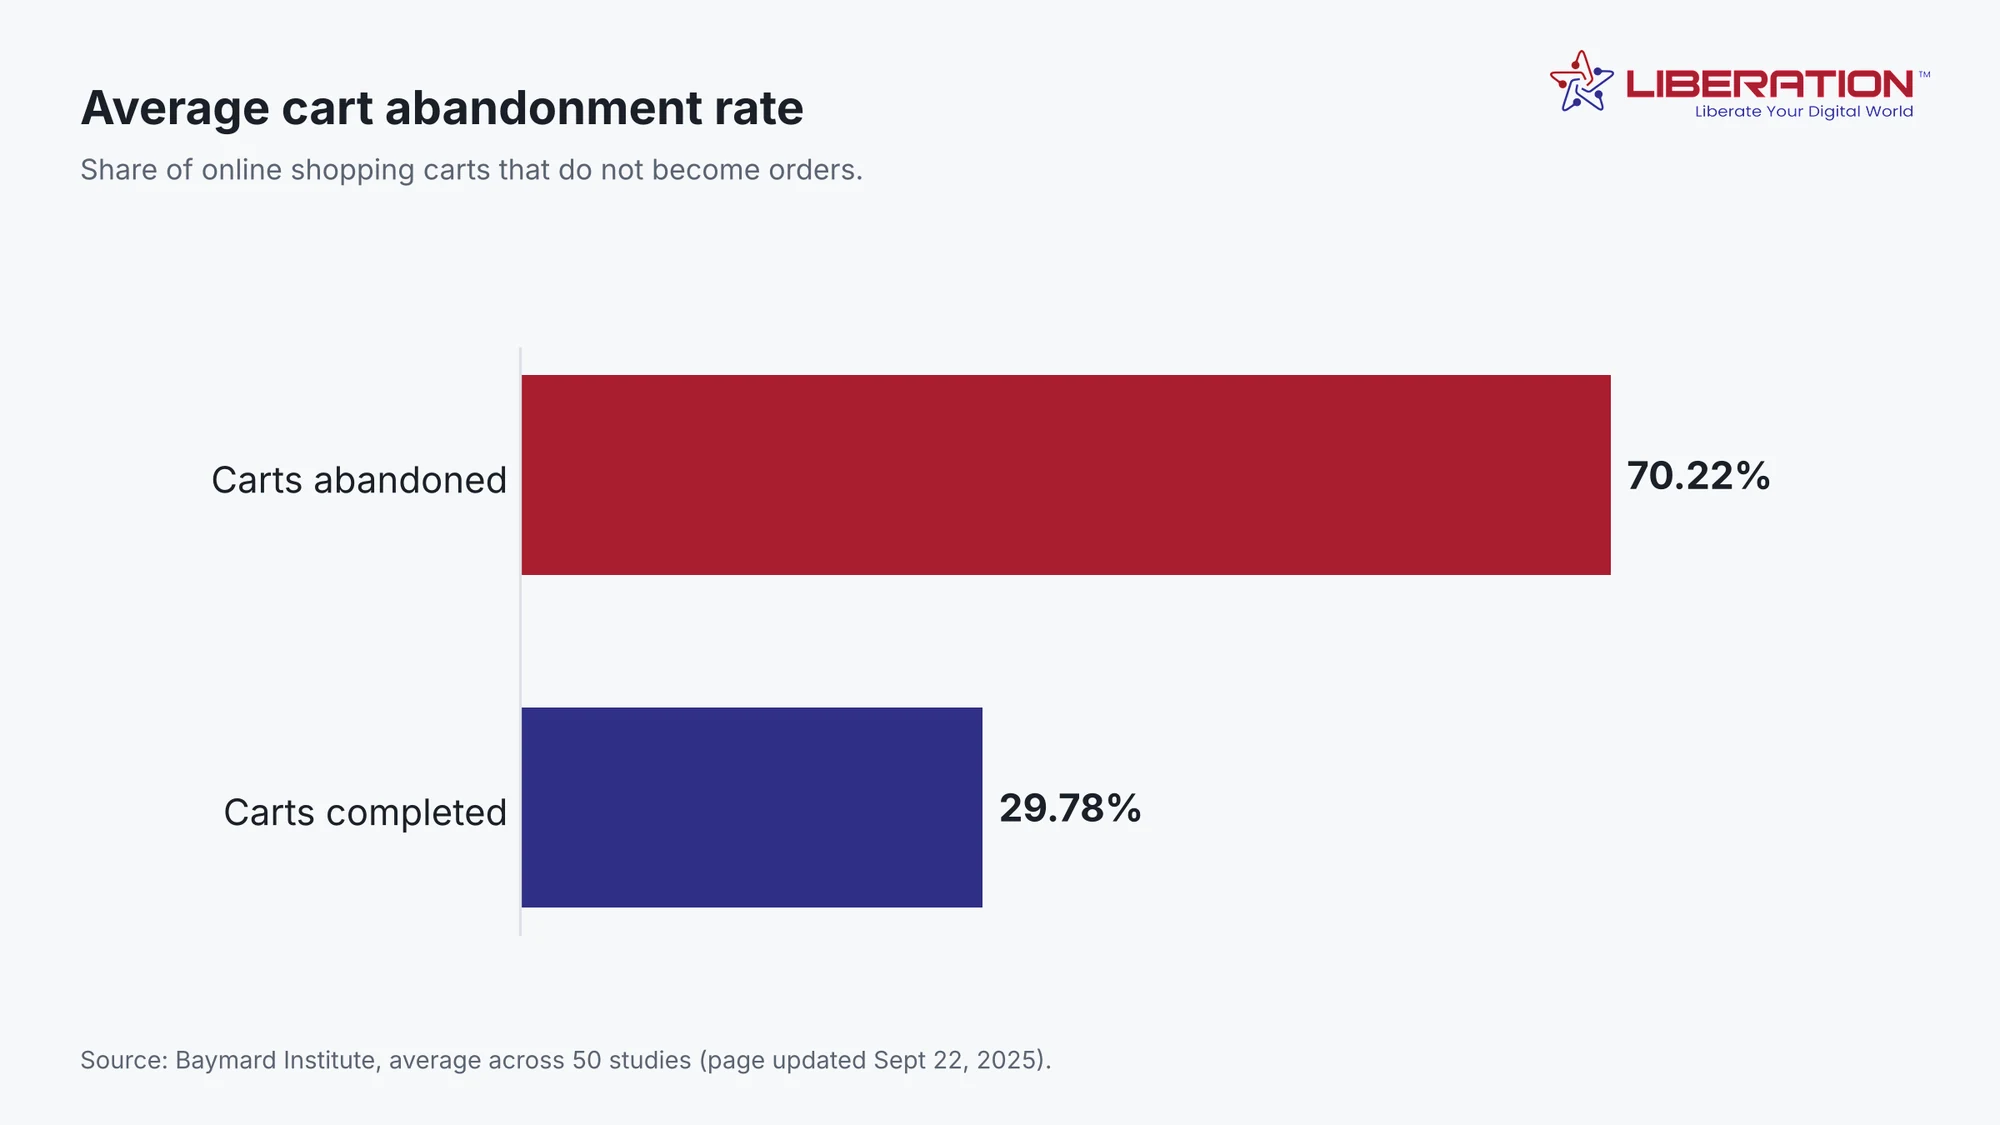
For a store that sees 1,000 carts a month, the average rate means about 700 never check out. Moving the rate by five points would add 50 orders from the same traffic, without buying a single extra visitor.
Why shoppers abandon carts
Baymard also lists the reasons shoppers give. Figure 2 shows the eight most common. Shoppers can give more than one answer, so the shares add up to more than 100%.
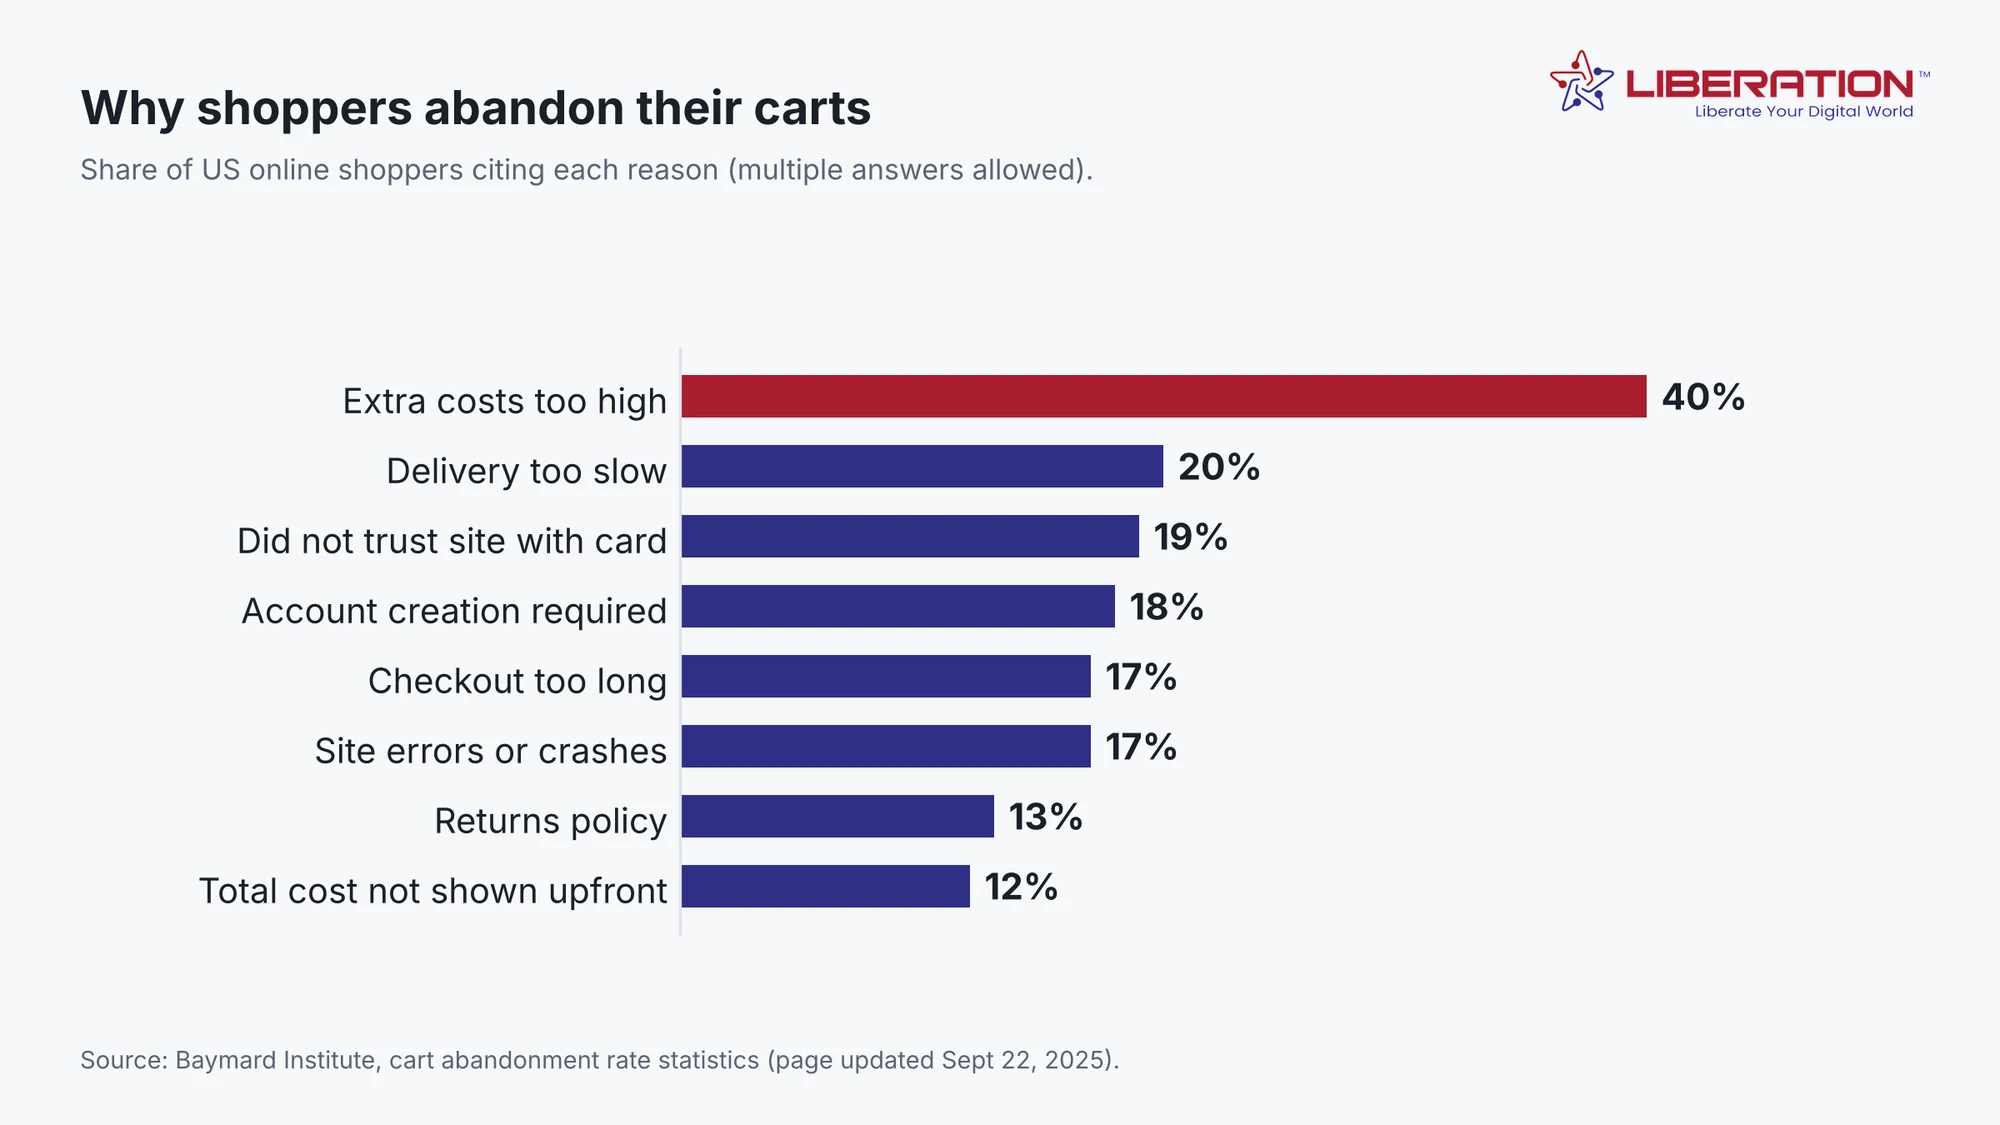
Most of these reasons come from decisions the store owner makes. Costs are shown too late. The account wall appears before payment. The form asks for too much. A slow or unstable site adds friction on top. Only a minority, such as a disliked returns policy, depend on the product or business model.
What these numbers mean for a small online store
A small store cannot match the delivery speed of the largest retailers, so the reasons it can control matter more. Cost transparency, guest checkout and a short form cost little to change. Trust is the other lever, because 19% of abandoners did not trust the site with their card details. Visible HTTPS, a recognized gateway and consistent branding at checkout all help. The checklist below ties each reason to a fix.
| Reason shoppers give | What to change |
|---|---|
| Extra costs too high (40%) | Show shipping and tax early, and consider free shipping thresholds |
| Account creation required (18%) | Offer guest checkout, and let customers create an account after the order |
| Did not trust the site with card details (19%) | Use HTTPS, a recognized payment gateway and clear security cues at checkout |
| Checkout too long (17%) or errors (17%) | Cut form fields, test on mobile, and monitor for site errors and downtime |
| Not enough payment methods (9%) | Support the main cards and wallets through your payment gateway |
Four checkout changes to make first
1. Show the full cost on the cart page
Add an estimated shipping and tax calculator before the customer enters an address. A surprise at the last step is the most common reason people leave.
2. Turn on guest checkout
Ask for an account only after the order. This removes a step for the 18% who leave when they are required to register.
3. Use a gateway shoppers recognize
A familiar card form and wallet options build trust at the moment it counts. See our payment gateway options for accepting cards on your store.
4. Fix speed and errors
Slow pages and checkout errors turn into abandoned carts. If your WooCommerce store feels sluggish, our guide on why a WooCommerce store is slow lists the usual causes.
Frequently asked questions about cart abandonment
What is the average cart abandonment rate?
Baymard Institute puts the average online shopping cart abandonment rate at 70.22%, calculated from 50 studies. That means about 7 in 10 carts do not become orders.
Why do people abandon online shopping carts?
The most cited reason is extra costs such as shipping, tax and fees, at 40%. Slow delivery (20%), distrust of the site with card details (19%) and a required account (18%) follow.
Is every abandoned cart a lost sale?
No. Baymard’s list shows 42% of shoppers were simply browsing or not ready to buy. Many abandoned carts were never going to convert, but the share caused by fixable problems is still large.
How can a small online store reduce cart abandonment?
Show the full cost early, offer guest checkout, keep checkout short, display trust signals near the card fields, offer the payment methods customers expect, and make sure the site loads quickly and does not throw errors.
Does website speed affect cart abandonment?
Yes. Baymard lists site errors or crashes as a cause for 17% of abandoners. Separate research on page load time also links slower pages with lower conversion rates.