
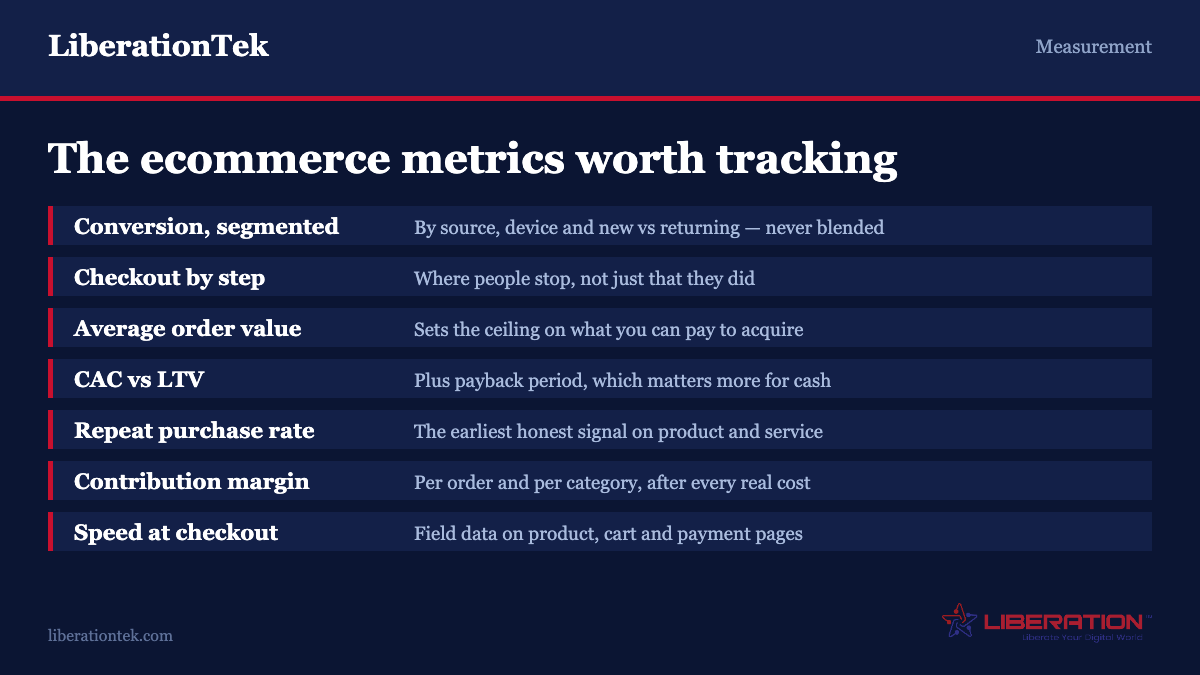
The ecommerce metrics worth tracking are conversion rate by traffic source, average order value, customer acquisition cost against lifetime value, repeat purchase rate, checkout completion by step, contribution margin per order, and speed at the point of purchase. Ignore raw sessions, bounce rate on product pages, and any benchmark quoted without a source. The documented average cart abandonment rate is 70.22% across 50 studies, but the useful version of that number is your own checkout completion rate broken down by step.
Open any ecommerce analytics dashboard and you will find several dozen numbers. Sessions, users, pageviews, bounce rate, average session duration, pages per session, cart abandonment, revenue, transactions, conversion rate, and a dozen more if you have installed anything extra.
Almost none of them will change what you do this week. Not because measurement is useless, but because most default dashboards report activity rather than decisions, and the two look similar until you try to act on one.
Here is the smaller set worth your attention, why each earns its place, and what to do when the number moves.
What makes ecommerce metrics worth tracking
Before the list, the filter. A metric is worth tracking if you can finish this sentence: “If this number goes down, I will do X.”
Sessions fail that test. If sessions drop, what do you do? Buy more traffic? Only if the traffic you were getting was converting, which is a different number. Sessions are an input to a decision, never the decision.
Conversion rate by traffic source passes. If paid search conversion halves while organic holds steady, you know where to look and roughly what happened.
Run every number on your dashboard through that sentence. Most will not survive, and removing them makes the survivors easier to see.
1. Conversion rate, segmented
Site-wide conversion rate is the number everyone quotes and the least useful form of it. A single blended figure averages together people who arrived from a branded search ready to buy and people who bounced in from a social ad, and the average tells you about neither.
Segment it at least three ways.
By traffic source. Organic, paid, email, direct, referral, social. This tells you which channels bring buyers rather than visitors, which is the only question that matters when deciding where to spend.
By device. Mobile conversion is almost always lower than desktop, and some of that gap is genuine — people browse on phones and buy on laptops. But a gap much wider than the norm for your category usually means something on mobile is broken, and checkout forms are the usual suspect.
By new versus returning. Returning visitors convert at a multiple of new ones. If your blended rate is improving only because your returning share grew, you have not got better at converting strangers — you have changed the mix.
When it moves: find the segment that moved. A site-wide drop is almost never site-wide.
2. Checkout completion rate, by step
Cart abandonment is the famous metric and the blunt one. The Baymard Institute’s documented average across fifty separate studies is 70.22%. That figure is useful for one thing: reassuring you that your own high number is normal.
It cannot tell you what to fix, because “added to cart and did not buy” covers everything from a deliberate price comparison to a form that rejects valid postcodes. What you need is completion rate at each step — cart to checkout, checkout to shipping, shipping to payment, payment to confirmation — so you can see where people actually stop.
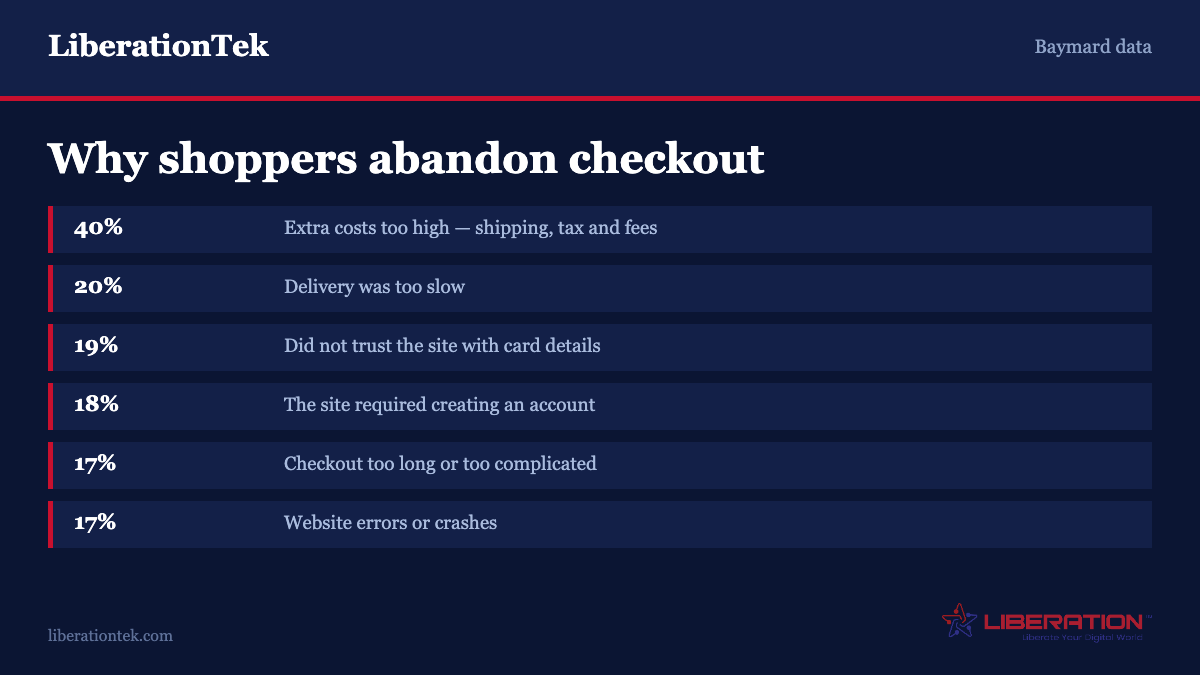
Baymard’s research on why people abandon during checkout, excluding those only browsing, is worth knowing because the answers are mostly fixable: extra costs too high at 40%, delivery too slow at 20%, not trusting the site with card details at 19%, forced account creation at 18%, and a checkout that is too long or that errors out at 17% each.
Look at that list again. The top answer is not price, it is surprise — costs that appeared later than expected. The third and sixth are trust and reliability, both functions of how the site is built and hosted rather than what you sell.
Baymard puts the opportunity at a 35.26% increase in conversion rate for the average large ecommerce site through checkout design alone. Whatever your own ceiling, this is usually the cheapest place to find growth.
When it moves: a sudden drop at one step is almost always a technical fault. Test that step yourself, on a phone, on a different browser. Errors and crashes account for one abandonment in six.
3. Average order value
Revenue divided by number of orders. Simple, and the most direct lever you have, because raising it requires no additional visitors.
The reason it matters more than it looks: average order value sets the ceiling on what you can afford to pay for a customer. A store with a $40 average order and a 20% margin has $8 to spend acquiring a buyer. At $120 and the same margin it has $24, which is the difference between paid acquisition working and not working.
Track it monthly alongside your promotional calendar. A rise driven by a genuine change in product mix is good news; a rise driven by a free-shipping threshold you just raised is a different thing and may cost you orders.
When it moves: check whether order count moved the other way. Average order value rising while orders fall is usually a threshold pushing small buyers away, not an upsell working.
4. Customer acquisition cost against lifetime value
Two numbers that are meaningless apart and decisive together.
Acquisition cost is total sales and marketing spend for a period divided by new customers acquired in it. Include everything — ad spend, agency fees, tools, a fair share of anyone’s salary who works on it. Undercounting here is the most common way stores convince themselves an unprofitable channel is working.
Lifetime value is what a customer is worth over the whole relationship. The workable approximation for a small store is average order value multiplied by purchase frequency per year, multiplied by average retained years, multiplied by gross margin. Use margin, not revenue — lifetime revenue flatters every calculation it appears in.
The ratio between them is the thing. Below 1:1 you are paying more than a customer is worth. Around 3:1 is the commonly cited healthy range for a small store. Far above it and you are probably underinvesting in growth rather than being admirably efficient.
The other half is payback period — how many months until a customer has repaid what you spent to acquire them. A 3:1 ratio with an eighteen-month payback will still damage your cash flow, because you are funding the gap out of working capital. For a small business, payback period often matters more than the ratio.
When it moves: acquisition cost rising is usually channel saturation or more competition in an auction. Lifetime value falling is a retention problem, and retention problems do not get fixed by buying more traffic.
5. Repeat purchase rate
The share of customers who buy again within a defined window — ninety days or a year, depending on what you sell.
This is the metric most small stores neglect and the one with the best economics behind it. You have already paid to acquire these people. A second purchase carries no acquisition cost and usually a higher average order value, because the trust barrier is gone.
It is also the earliest honest signal about whether the product and the experience are good. Conversion rate tells you the sales page works. Repeat purchase rate tells you what happened after the box arrived.
Pick the window deliberately. For consumables, ninety days is meaningful. For furniture or equipment, annual, and you should expect a low number without it being a problem.
When it moves: a falling rate points at fulfilment, product quality or post-purchase communication, in roughly that order. It is rarely a marketing problem.
6. Contribution margin per order
Revenue per order, minus cost of goods, minus payment processing, minus shipping and packaging, minus the acquisition cost attributable to that order.
This is the number that tells you whether you have a business. Plenty of stores grow revenue enthusiastically for two years on orders that lose money once the real costs are counted, and the pattern is invisible if you watch only revenue and conversion rate.
Calculate it per product category, not just overall. Almost every store has a category that looks like a bestseller and is actually subsidised by the rest — typically something heavy, cheap, or frequently returned. Finding it usually changes what you promote.
Include returns honestly. A 20% return rate on a category does not reduce its margin by 20%; it reduces it by the full cost of outbound shipping, return shipping, handling, and often the resaleable value of the item.
When it moves: this one moves slowly and silently. Review it quarterly rather than daily, and treat any negative category as a decision to make rather than a number to note.
7. Site speed at the point of purchase
Not average page load across the site — the speed of the pages where money changes hands. Product page, cart, checkout.
Speed earns a place here because it is simultaneously a technical measurement and a revenue measurement, and one of the few you can fix without changing your product, pricing or marketing.
Measure the Core Web Vitals — Largest Contentful Paint, Interaction to Next Paint and Cumulative Layout Shift — on those specific templates, using field data from real visitors rather than a lab test on a fast connection in a data centre. Google Search Console reports this grouped by page type.
Watch mobile specifically. A checkout that loads in 1.5 seconds on office wifi may take six on a phone with a weak signal, and that visitor is in the 17% who abandon because of errors and delays.
When it moves: a gradual decline is usually accumulated plugins and tracking scripts. A sudden one is usually a change you or your host made. Our notes on vetting a WordPress plugin cover how to assess what a new addition costs before you install it.
What to stop tracking
Raw sessions and pageviews. An input, not a decision. Keep them visible as context; do not report them as results.
Bounce rate on product pages. Modern analytics count engagement rather than a single pageview, and even then a visitor who reads a product page thoroughly and leaves to think about it is not a failure. The metric conflates too many behaviours.
Average session duration. Longer is not better. A customer who finds what they want and buys it in ninety seconds is the ideal outcome, and they drag this number down.
Social media followers. Track the conversion rate of social traffic instead. Followers are a proxy for a proxy.
Any benchmark without a source. A great many “average ecommerce conversion rate” figures circulate with no methodology attached, and get applied to stores selling $8 candles and $8,000 machinery alike. Your comparison is to your own number last quarter. That is the only benchmark controlling for your product, your price point and your market.
Setting this up without a data team
You do not need a warehouse and a BI tool. For a small store this is a one-page monthly review.
Configure ecommerce tracking properly first. Everything above depends on the platform reliably recording purchases with their value. Verify it by comparing a month of analytics revenue against your actual takings — if they disagree by more than a percent or two, fix that before trusting anything else.
Track checkout as discrete steps so you can see where people stop rather than only that they did.
Pull cost data manually. Acquisition cost, cost of goods and contribution margin will not appear in your analytics on their own. A spreadsheet updated monthly is entirely adequate and better than an integration nobody maintains.
Review monthly, not daily. Daily ecommerce metrics for a small store are mostly noise, and watching them produces reactive decisions.
Write down the decision each number would trigger before you start collecting it. If you cannot name one, remove it from the report.
Frequently asked questions
What is a good ecommerce conversion rate?
There is no useful universal answer, and benchmarks circulated without a stated methodology should be ignored — they average together stores selling $8 consumables and $8,000 equipment. The comparison that matters is your own rate last quarter, segmented by traffic source and device. A blended site-wide figure hides the only differences you can act on, because branded search traffic and cold social traffic convert nothing like each other.
What is the average cart abandonment rate?
The Baymard Institute’s documented average is 70.22%, calculated from 50 separate studies. It is useful for reassurance and nearly useless for diagnosis, because it groups deliberate price comparison together with checkout forms that are failing. Track completion rate at each checkout step instead — cart to checkout, shipping, payment, confirmation — so you can see where people actually stop and why.
Why do customers abandon checkout?
Baymard’s research on abandonment during checkout, excluding people only browsing, puts extra costs first at 40% — shipping, tax and fees that appeared later than expected. Then slow delivery at 20%, not trusting the site with card details at 19%, forced account creation at 18%, and a checkout that is too long or that errors out at 17% each. Most of that list is about the experience, not the price.
How do you calculate customer lifetime value for a small store?
A workable approximation is average order value multiplied by purchase frequency per year, multiplied by the average number of years a customer stays, multiplied by gross margin. Use margin rather than revenue, because lifetime revenue flatters every calculation it appears in. Then compare it to acquisition cost: around 3:1 is the commonly cited healthy range, but check payback period too, since a good ratio with an eighteen-month payback still drains working capital.
Which ecommerce metrics should I stop tracking?
Raw sessions and pageviews, which are inputs rather than decisions; bounce rate on product pages, which conflates a careful reader with a mis-click; average session duration, since a customer who buys in ninety seconds lowers it and that is the outcome you want; social follower counts, where the conversion rate of social traffic is the real measure; and any industry benchmark quoted without a stated source and methodology.
Does site speed actually affect ecommerce revenue?
Yes, and measurably at the point of purchase rather than site-wide. Website errors and slow performance account for around 17% of checkout abandonment in Baymard’s data. Measure Core Web Vitals on your product, cart and checkout templates specifically, using field data from real visitors rather than a lab test — a checkout that loads quickly on office wifi can take several times longer on a phone with a weak signal, and that is where orders are lost.
Sources
The abandonment figures above come from one source, which publishes its methodology and the studies behind it. The speed definitions come from the people who set them.
- Cart Abandonment Rate Statistics — Baymard Institute. 50 studies, with the reasons behind checkout abandonment broken out.
- Core Web Vitals — web.dev. What LCP, INP and CLS measure and the thresholds that count as good.